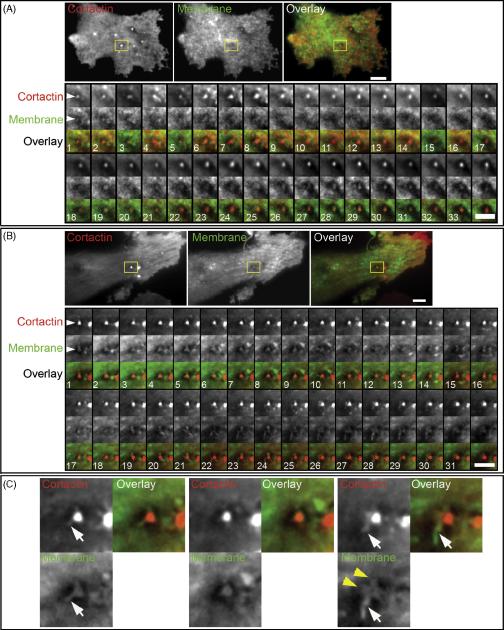
Figure 1.
Cell membrane dynamics at invadopodia. Human breast carcinoma wt c-Src MDA-MB-231 cells expressing GFP-Cortactin and membrane marker IL2R-mCherry were cultured on a layer of FN. A. Initiation of invadopodium formation. An invadopodium in early stages of formation is shown selected with a region-of-interest (ROI) frame. The ROI montage shows every 6th frame, and the total duration of the time-lapse image acquisition used for the montage is 6.9 min. Scale bar indicates 3 μm. B. Mature invadopodium. This stage is characterized by a high degree of cell membrane morphological changes as exemplified by the invadopodial complex analyzed in the ROI. The montage of ROIs shows every 5th frame, and the total duration of the time-lapse image acquisition used for the montage is 5.3 min. Scale bar indicates 3 μm. C. Enlarged views of three frames from the ROI montage shown in B. White arrows point to filament-like membrane extensions that originate from the cortactin core; they also indicate the furthest extent of cortactin along the membrane filament-like protrusion. Yellow arrowheads point to membrane ruffles.

