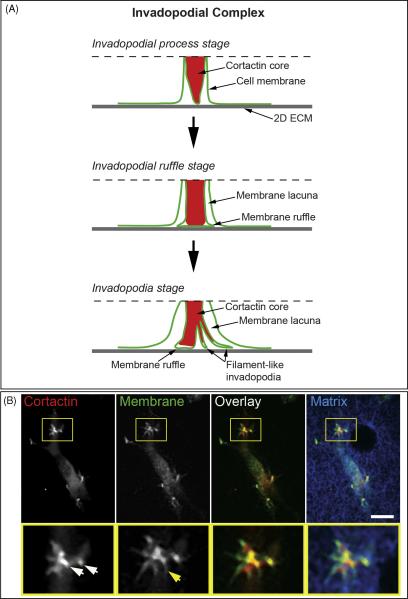
Figure 3.
A, Model of the invadopodial complex. Dashed line indicates the upper boundary of the membrane-cytoplasmic zone visualized by TIRF microscopy. B, Invadopodial complex formation in wt c-Src MDA-MB-231 cells invading 3D matrix of 3 mg/ml rat tail collagen type I fluorescently labeled with Alexa647. MDA-MB-231 cells transiently expressing GFP-Cortactin and IL2R-mCherry were polymerized between two layers of rat tail collagen and allowed to invade 3D collagen matrix overnight. White arrows point to cortactin-rich invadopodial cores and yellow arrow points to filament-like invadopodia. Scale bar indicates 10 μm.

