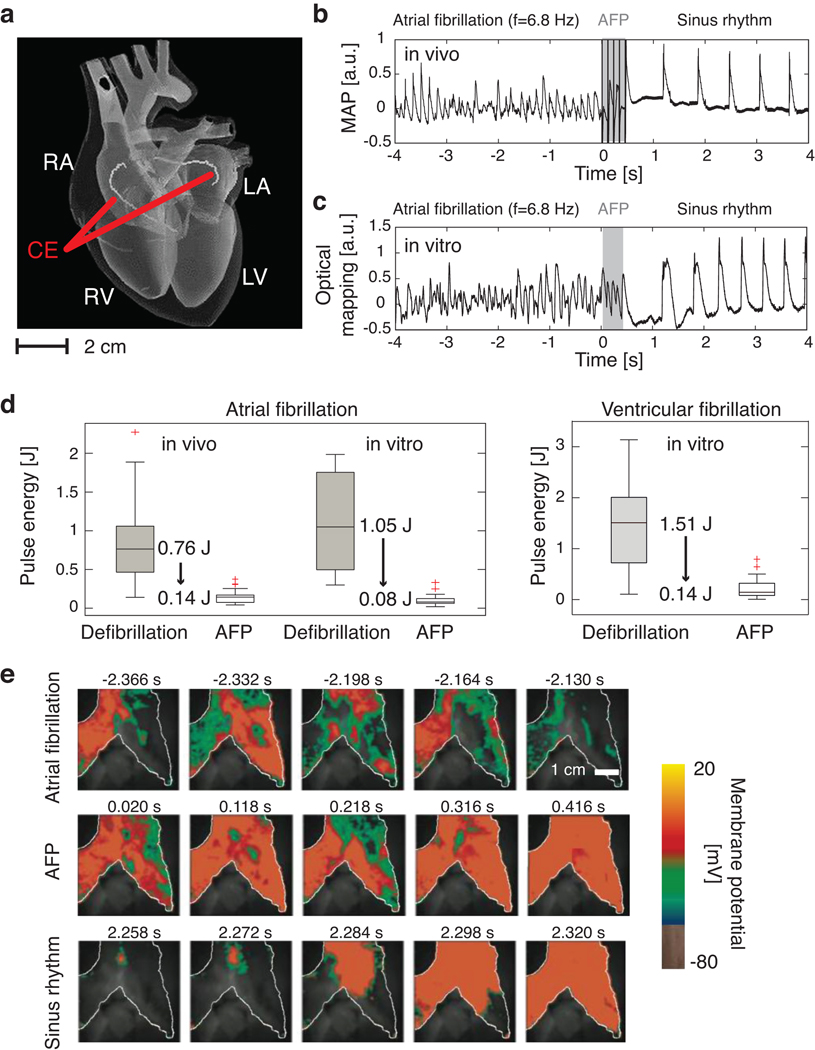
Figure 1. Low-energy termination of cardiac electrical turbulence in vivo and in vitro.
a Schematic of the anatomy of the heart: RA=right atrium, LA=left atrium, RV=right ventricle, LV=left ventricle. A pulsed electric field was applied with standard cardioversion coiled wire electrodes (CE) inserted into the left and right atria by catheters (see SI).
b Monophasic Action Potential (MAP) recording of termination of AF using LEAP in vivo. Dominant frequency fv=6.8±0.1Hz, n=5 pulses, pulse duration Δt=8ms, pacing cycle length Tp=99ms, pulse energy E=0.074±0.012J.
c Termination of AF in vitro measured from the atrial epicardium of the same heart as in b by optical mapping (see e). The signal from a 0.3×0.3 mm2 region is shown (fv=6.8±0.1Hz, n=5, Δt=8ms, Tp=90ms, E=0.066±0.017J).
d Pulse energy reduction of LEAP vs. standard defibrillation. In vivo AF (N=7): LEAP (56 episodes, mean energy Ē=0.14±0.08J); defibrillation (22 episodes, Ē=0.89±0.56J). In vitro AF (N=5): LEAP (46 episodes, Ē=0.10±0.07J); defibrillation (39 episodes, Ē=1.15±0.58J). In vitro ventricular fibrillation (N=7): LEAP (28 episodes, Ē=0.17±0.16J); defibrillation (12 episodes, Ē=1.34±0.89J; see SI). The box plots show the median and the 25th and 75th percentiles. The whiskers indicate the statistically significant data range and red crosses mark outliers.
e Optical mapping of the AF termination also shown in panel c. During AF complex spatio-temporal propagation of electrical excitation waves was observed (white line indicates boundary of atrium). LEAP (n=5, Δt=90 ms) progressively synchronized the tissue (movies S1, S2).
Data given as mean±standard deviation unless stated otherwise.

