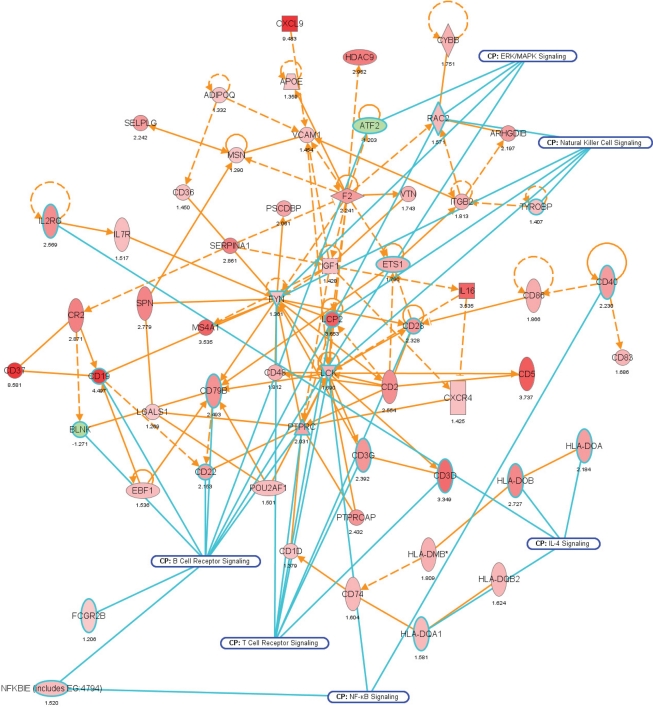
Figure 7.
Network representation of altered cellular functions during colonization of the mouse colon by A. muciniphila for the gene ontology (GO) category “immune response.” The network shows that most of the genes regulating the immune response are up-regulated during colonization. Central regulatory genes encode growth factors (e.g., Igf1), cell surface molecules (Cd19, Cd37), (receptor) phosphatases (Ptprc or Cd45), and protein kinases (Lck, Fyn) that regulate (immune) cell proliferation and differentiation. The protein interaction network was derived from the transcription data using ingenuity pathway analysis (IPA). Nodes indicate proteins, the yellow lines connecting them represent interactions (e.g., protein–protein binding or phosphorylation events) that are mapped by Ingenuity’s knowledge base (see Materials and Methods). Colors indicate altered transcription of the encoding genes, with deeper shades of red indicating stronger up-regulation, and deeper shades of green indicating stronger down-regulation. The genes and their encoded proteins that are used to reconstruct specific networks were selected based on overrepresentation of GO categories (“cellular functions” in IPA) and involvement in significantly (see Materials and Methods) modulated canonical pathways. The overlays with blue radiating lines represent some of these canonical pathways (CP) and are useful to indicate in which cellular pathways differentially regulated genes and their interacting products participate for the given GO categories. Note that in this network exemplifying the genetic regulation of the mouse colonic immune response to A. muciniphila, most of the genes are up-regulated, indicating that the immune response was induced following colonization of these bacteria.

