FIGURE 3.
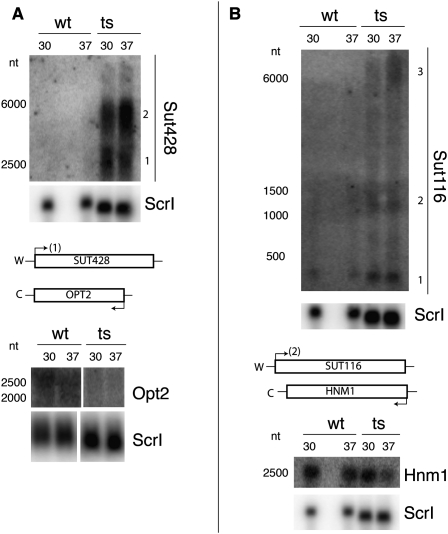
Antisense RNA accumulation and overlapping mRNA de-enrichment with an RNase P mutation. Total RNA isolated from replicate cultures of wild-type (wt) or RNase P mutant (ts) samples grown at either 30°C or 37°C are shown separated on 1.4% denaturing agarose gels with subsequent Northern blot analysis. Sizes (in nucleotides, nt) were estimated from known markers (Materials and Methods), and W and C strands are as in Figure 1. (A) Northern blots were probed for Sut428 or Opt2 RNAs, reprobing for Scr1 RNA as a loading control. (B) Northern blots were probed for Sut116 or Hnm1 and reprobed for Scr1 as a loading control. In both cases shown, the SUT loci accumulated RNA that differs from previous annotations, which were used for this data set (Xu et al. 2009). Numbers are shown indicating different RNA species. Importantly, the RNA species most consistent with established annotation is indicated at the transcription site on the loci diagram below the Northern blots: Sut428 (1) and Sut116 (2). Also, the “sense” mRNA is shown significantly de-enriched in both panels (see also Fig. 1).

