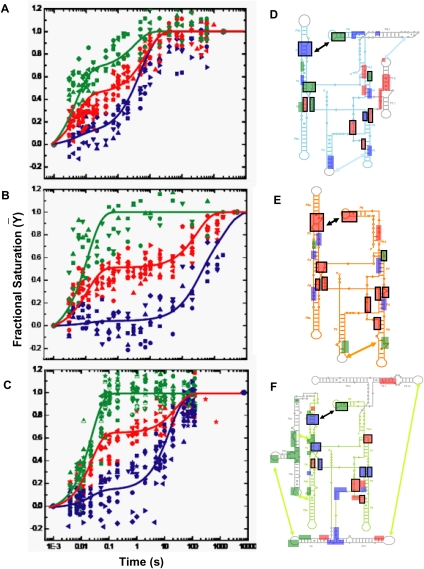
FIGURE 2.
Clustering the kinetic progress curves derived from time resolved •OH footprinting during Mg2+ mediated folding of (A) Twort, (B) Azoarcus, and (C) Tetrahymena ribozymes. The 24 progress curves of Twort, 19 of Azoarcus, and 33 of Tetrahymena, each representing the time-dependent formation of a tertiary contact, statistically clustered into three groups—fast (green), medium (red), and slow (blue). The cluster centroids, plotted as solid lines though the clusters, represent the average kinetic behavior of a group and are used in the KinFold analysis. For cluster affiliations of the tertiary contacts please refer to Supplemental Table S1. Hydroxyl radical footprints are shown as boxes, colored according to their cluster affiliations, on the secondary structures of the three ribozymes—(D) Twort, (E) Azoarcus, and (F) Tetrahymena. The core helices (P4–P5–P6 and P3–P7–P8) and the substrate docking site (P1) are shown in cyan, orange, and lime for D, E, and F, respectively; while intron-specific peripheral domains, as described in Figure 1A, are shown in gray. Boxes representing the homologous tertiary interactions, depicted in Figure 1A, are indicated by black outlines.

