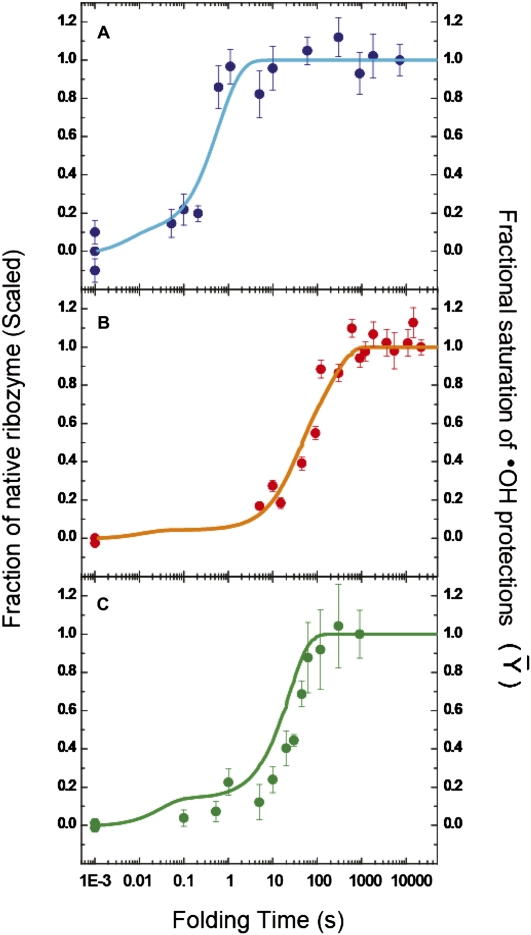
FIGURE 5.
Correspondence between •OH footprinting and activity assays. The time-dependent evolutions of the native ribozyme species, as measured by enzymatic activity assays (filled circles with error bars), and the time-dependent appearance of the folded ribozyme species, as derived form KinFold analysis of time-resolved •OH footprinting data (solid lines), for the Twort (A: blue), Azoarcus (B: orange), and Tetrahymena (C: green) ribozymes, are depicted. The activity assays are described in Supplemental Figures S5, S6, and S7. The left ordinate, in all three panels, represents the fraction of substrate cleaved during the initial product burst phase. The fraction native at each time point is scaled either with respect to a prefolded control (incubated at 50°C—for the Twort and Azoarcus ribozymes) or with respect to the 15-min time point (end of the first phase—for the Tetrahymena ribozyme). The right ordinate represents the extent to which a RNA backbone region has become solvent inaccessible, as compared with the solvent accessibility of the same region in the fully folded control (Fractional Saturation). The abscissa represents the time for which the ribozyme is allowed to fold, after addition of Mg2+ ions, prior to the addition of the oligonucleotide substrate and guanosine (in the enzymatic activity assays) or the addition of •OH generating reagents (in time resolved •OH footprinting experiments).

