
Figure 3.
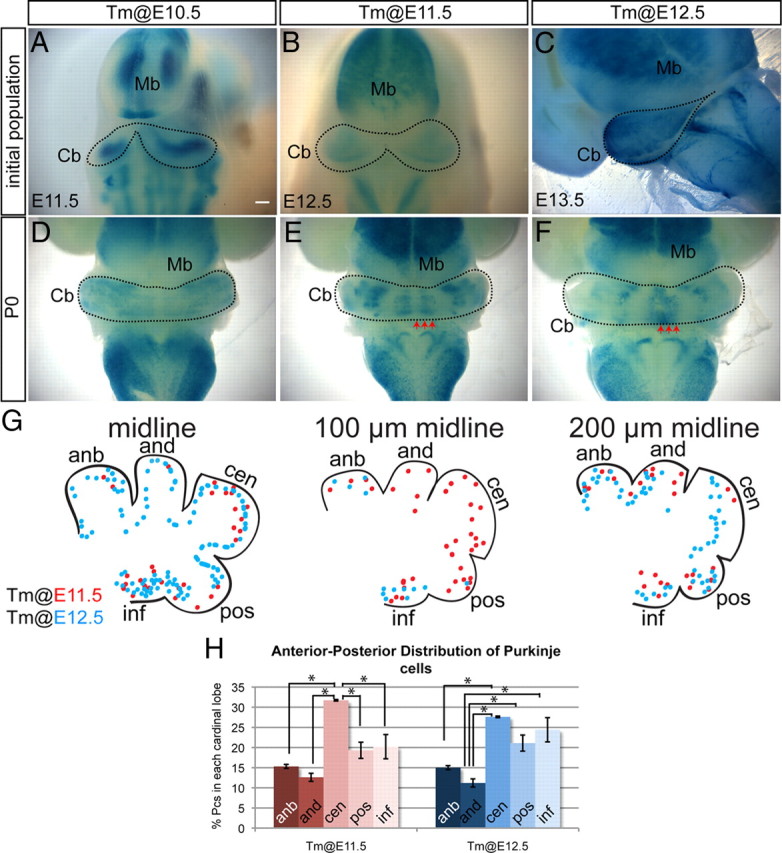
Purkinje cells marked with Ascl1CreER GIFM on consecutive days settle in distinct M-L and A-P patterns. A–C, Whole-mount Xgal staining of embryos 24 h after Tm administration. A, E11.5 whole-mount Xgal staining of Pcs marked at E10.5 reveals that Pcs were uniformly labeled in the lateral cerebellar primordium. B, At E12.5, whole-mount Xgal staining of Pcs marked at E11.5 shows labeling of Pcs in the cerebellar primordium excluding the midline. C, E13.5 whole-mount Xgal staining of Pcs marked at E12.5 reveals that Pcs were uniformly labeled throughout the M-L axis of the cerebellum. D, P0 whole-mount Xgal staining of Pcs marked at E10.5 shows that Pcs were found throughout the cerebellum except the midline. E, P0 whole-mount Xgal staining of Pcs marked at E11.5 depicts four pairs of distinct M-L Pc bands. F, P0 whole-mount Xgal staining of Pcs marked at E12.5 shows a single midline Pc band and two bilateral clusters in the paravermis. G, Summary schematic of A-P distribution pattern of Pcs marked at E11.5 (red) and E12.5 (blue). The arrows in E and F indicate positions analyzed in G. H, The percentage of marked Pcs residing in each of the cardinal lobes at E18.5 cerebellum. Error bars indicate SEM. Mb, Midbrain; Cb, cerebellum; anb, anterobasal; and, anterodorsal; cen, central; pos, posterior; inf, inferior. Scale bar: A–C, 200 μm; D–F, 350 μm. *p < 0.05.