
Fig. 1.
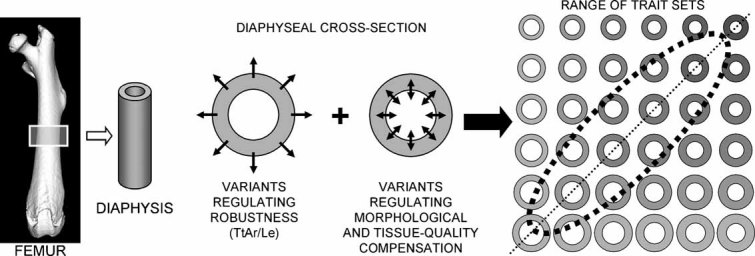
Schematic showing how sets of mid-diaphyseal traits acquired by an individual arise from variation in subperiosteal expansion defining robustness combined with variation in marrow infilling defining diaphyseal bone mass (cortical area) and mineralization defining tissue quality. These growth processes are highly coordinated, resulting in a population showing a narrow range of trait sets that is predictable based on bone robustness. The dashed diagonal line indicates the trait sets in which stiffness is maximized using minimum mass for a population. The gray value represents the variation in mineralization that accompanies morphologic compensation. The dashed elliptical line indicates the expected range of trait sets for a population showing variation in morphologic compensation.