
Fig. 3.
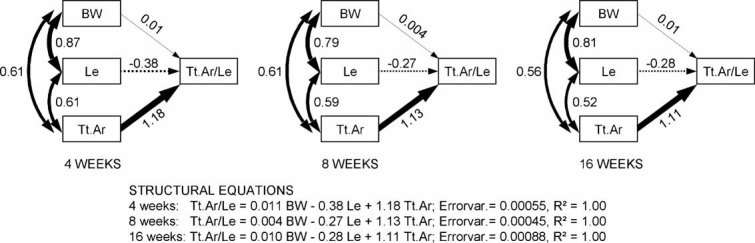
Path analysis was conducted to determine how variation in Tt.Ar and Le among the RI strains contributed to the variation in robustness (Tt.Ar/Le) when the effects of body weight were taken into consideration. The coefficients next to the curved arrows in the path models are the linear correlations between independent variables, and the coefficients next to the straight arrows are the relative contributions of each trait to Tt.Ar/Le in terms of standardized units (Z-scores). A large path coefficient was observed for Tt.Ar at each age, indicating that most of the variation in robustness was determined by Tt.Ar. Length contributed to the variation in Tt.Ar/Le but to a much lesser extent. The relative contributions were determined after controlling for the effects of body weight, which correlated significantly with Tt.Ar and Le but contributed very little to the variation in Tt.Ar/Le. The analyses were consistent across growth, suggesting that variation in robustness among the RI strains resulted primarily from variation in growth in width.