
Fig. 5.
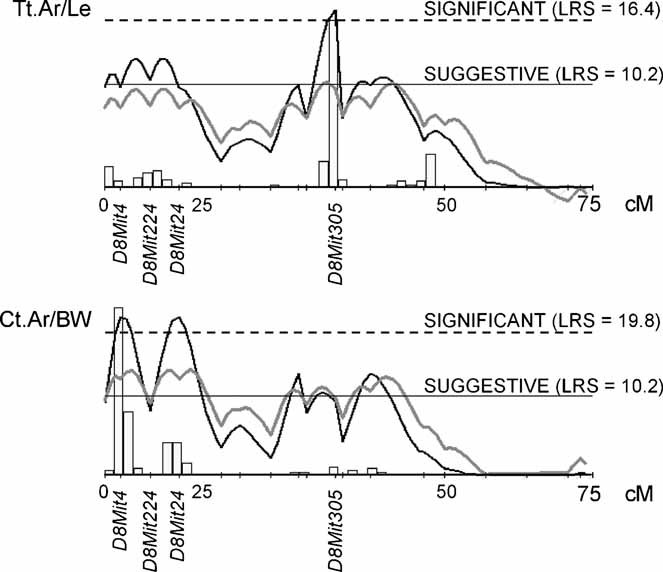
Interval mapping showed that QTLs for robustness (Tt.Ar/Le) and morphologic compensation (Ct.Ar/BW) measured at 8 weeks of age localized to different regions on chromosome 8. The solid black line represents the LRS level and the solid gray line represents the additive effect. The horizontal solid and dashed black lines represent the suggestive and significant (95th percentile) LRS levels, respectively. The vertical bars are the histograms showing the range of the maximum LRS values.