
Fig. 3.
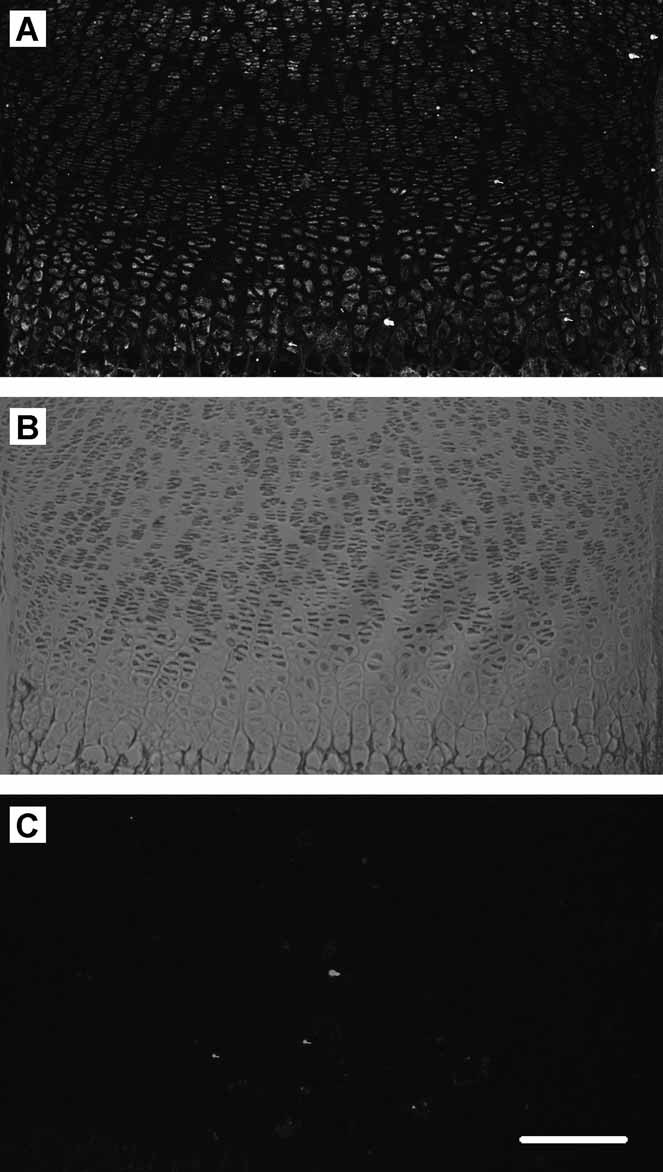
Growth plate NKCC distribution. Low-power (×10 objective) confocal microscope images (projected) of proximal tibial growth plate stained for NKCC (T4 antibody). Rat proximal tibias were removed and fixed, and transverse sections were prepared for immunohistochemistry as described in “Materials and Methods.” (A) AlexaFluor 488 secondary antibody fluorescence, (B) transmitted light image of the same field of view, and (C) as for panel A but with primary antibody omitted. The proliferative zone showed some fluorescence that appeared to reduce to the upper edge of the HZ. Cells in the HZ exhibited strong fluorescence, which even at this low magnification appeared to be localized to the plasma membrane. Scale bar = 200 µm.