
Fig. 4.
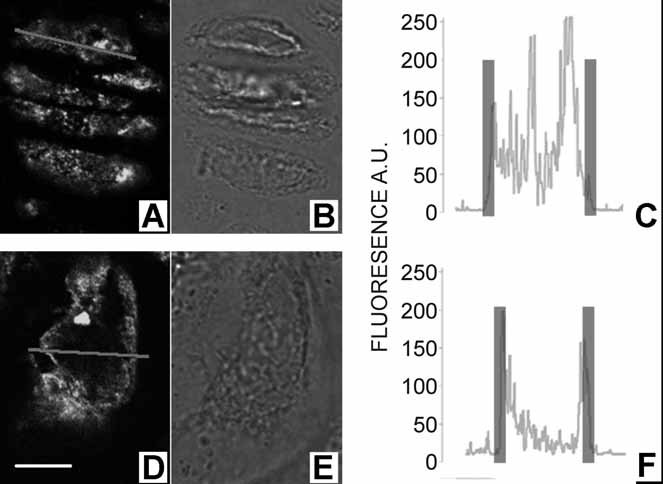
Growth plate chondrocyte NKCC localization in typical proliferative (A–C) and hypertrophic (D–F) zone chondrocytes. Rat proximal tibias were prepared for and subjected to immunohistochemical procedures, and then images were acquired as described in “Materials and Methods.” NKCC immunofluorescence from a single optical section is shown in panels A and D, with the corresponding transmitted light images (B) and (E) for PZCs and HZCs, respectively. The intensity profile along a line drawn through the center of a cell (gray line in A and D) is shown (C, F). The overlaid transparent vertical bars in C and F indicate the approximate position of the cytoplasmic membrane determined from the transmitted light image (B, E). Fluorescence intensity is in arbitrary units (AUs). For all panels, scale bar = 5 µm.