
Fig. 5.
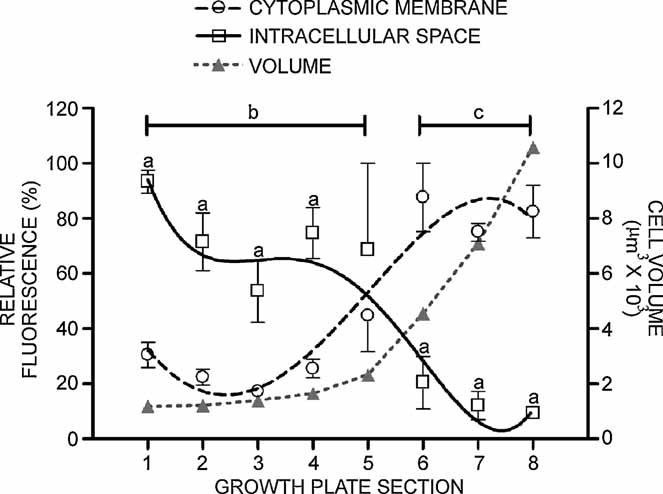
Quantification of cellular NKCC distribution along the growth plate. The fluorescence associated with the plasma membrane or intracellular space was obtained from images of cells along the entire length of the growth plate (see “Materials and Methods” and Fig. 4). Owing to the variability in section position, angle, and inherent differences in growth plate dimensions, cell positions within the growth plate were expressed in eight equidistant sections; sections 1 to 3 PZC and 5 to 8 HZC. Significant differences (ap < .05, Student's t test) between the fluorescent signal of the intracellular space (solid line, □) and membrane-associated fluorescence (broken line, ○). Similarly, significant differences (p < .05, Student's t test) between PZC and HZC intracellular fluorescence (b) and between PZC and HZC membrane-associated fluorescence (c) are shown. An overlay (gray line, ▵) of cell volumes (right axis) has been included to highlight the appearance of NKCC in the plasma membrane immediately preceding a volume increase (data replotted from ref. (2)). Data points are for the mean of a minimum of four animals (421 cells) with bars denoting SEM.