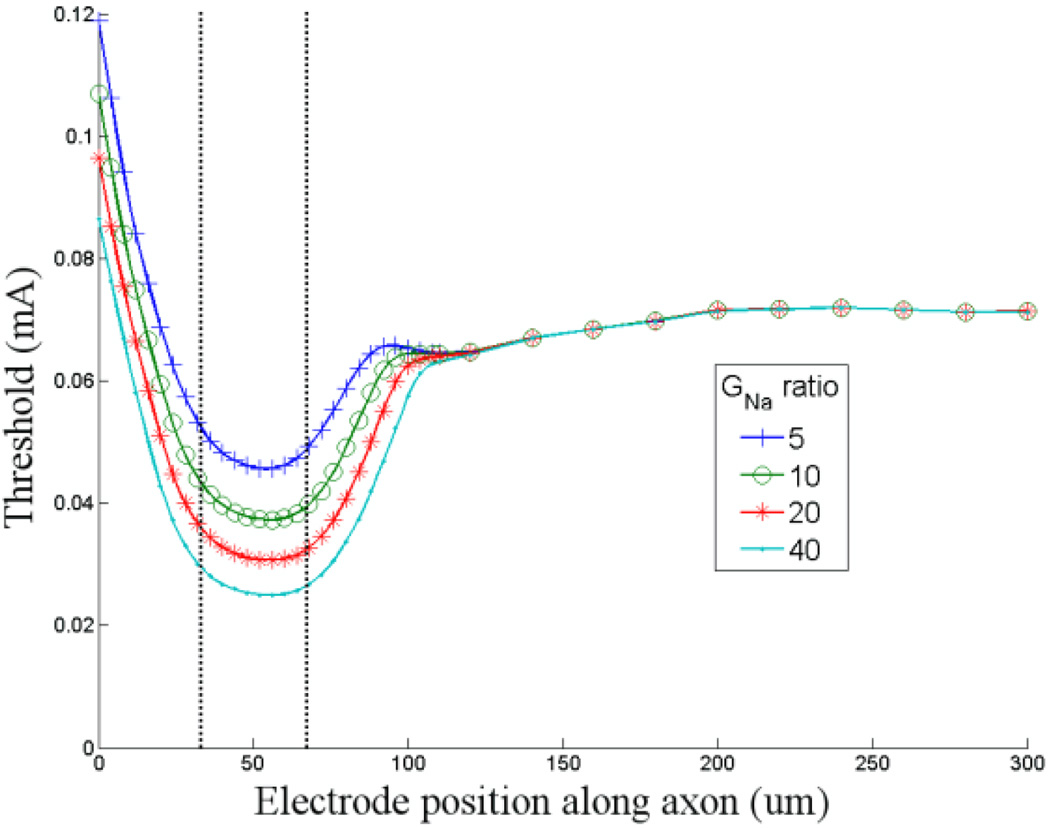
Figure 3. Increased band GNa results in lower activation thresholds.
Threshold is plotted as a function of stimulating electrode location for four different levels of sodium channel conductance (ĜNa) within the band. The lowest level of ĜNa in the band was a factor of five greater than the ĜNa of the distal axon. The highest level of ĜNa in the band was 40 times the axon ĜNa. The vertical lines indicate the edges of the sodium channel band. Zero on the abscissa corresponds to the closest edge of the soma. The minimum thresholds for ratios of 5, 10, 20 and 40 were 0.046, 0.037, 0.031 and 0.025 mA (respectively).

