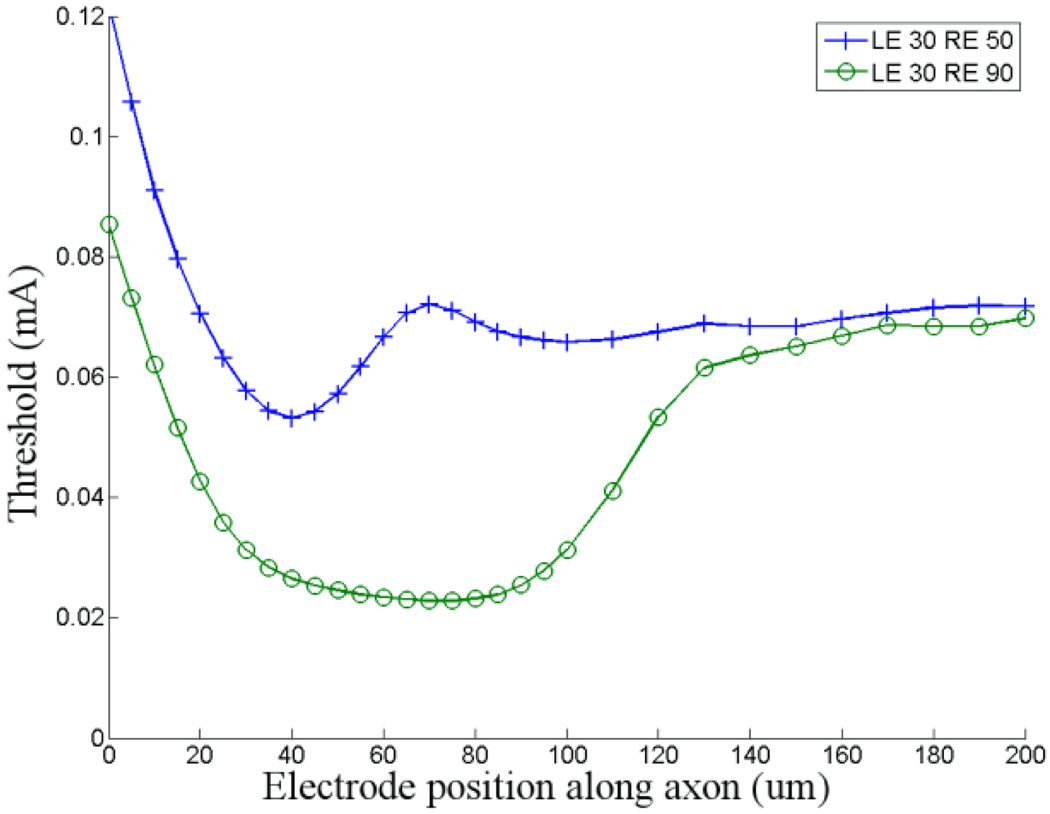
Figure 5. Estimating the range of thresholds.
Thresholds in the high- and low-threshold models (see text) are plotted as a function of the position of the stimulating electrode (vertical tick marks and circles, respectively). LE: distance from the soma to the left (proximal) edge of the band (in µm); RE: distance from the soma to the right edge of the band.

