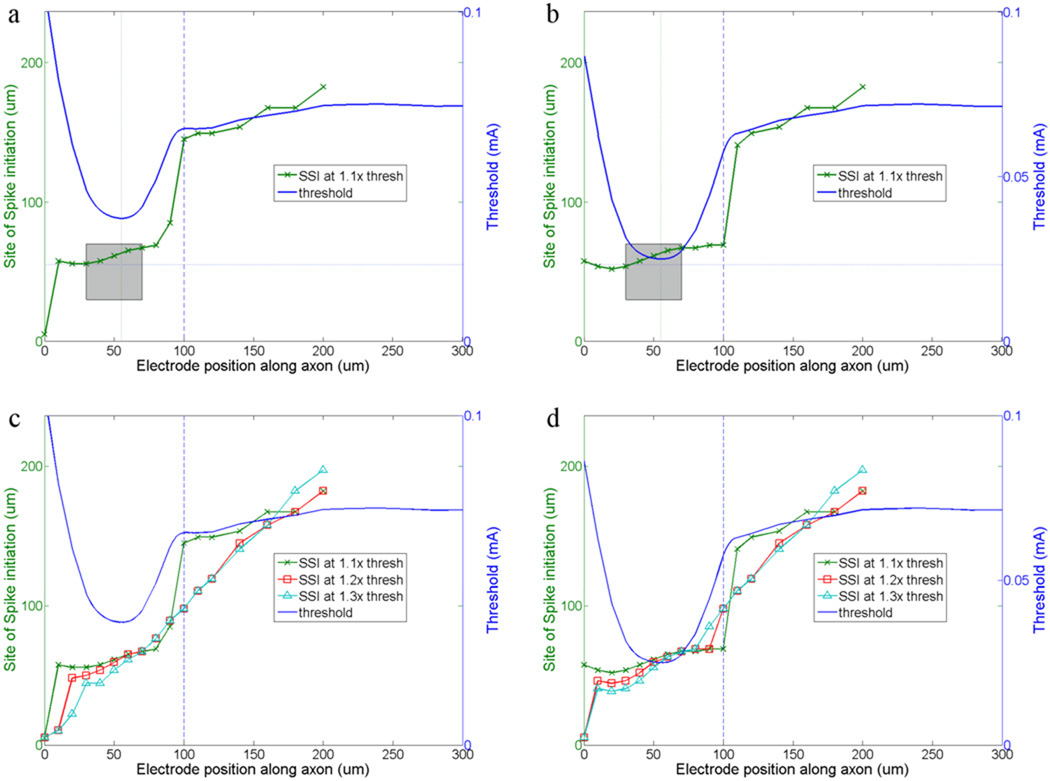
Figure 7. The site of spike initiation is influenced by electrode position and band properties.
(a) Threshold and site of spike initiation (SSI) are both plotted as a function of stimulating electrode position. The amplitude of the stimulus pulse was fixed at 1.1× threshold and the band to soma GNa ratio was fixed at 5. The vertical line indicates a distance of 100um from the soma and is used to compare results in (b). The shaded box marks the edges of the band for both axes. The thin vertical line indicates the location of the stimulating electrode for which threshold was minimum; the thin horizontal line indicates the same location. (b) Similar to (a) except the GNa ratio is 40. (c, d) Similar to (a) and (b) respectively, except additional runs were made with the stimulus amplitude increased to both 1.2× and 1.3× threshold. In all plots the vertical lines at 30 and 70 µm indicate the extent of the band relative to the position of the stimulating electrode (x-axis) and horizontal lines (at 30 and 70 µm (right y-axis), indicate the extent of the band relative to the site of spike initiation. In all panels, the thin section extends from 90–160 µm.

