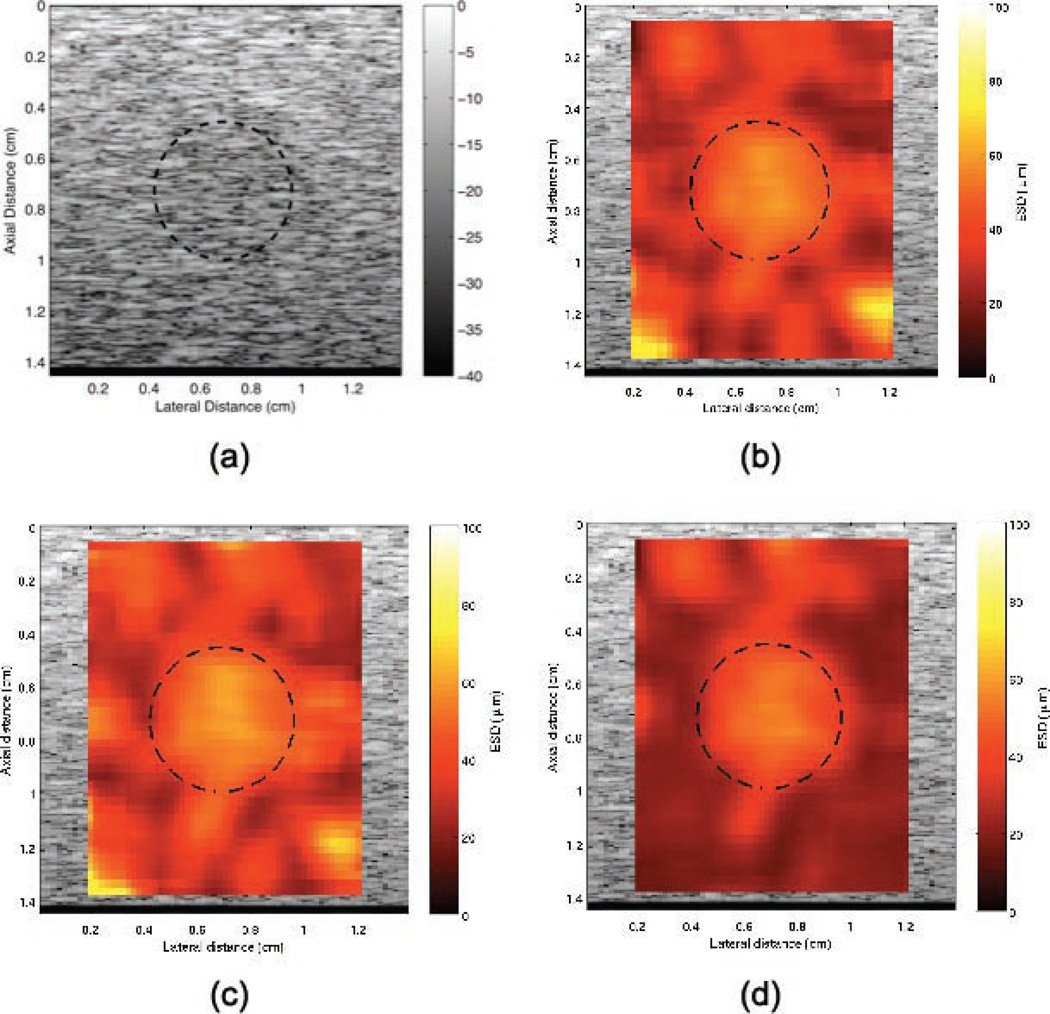
Fig. 3.
(a) B-mode image of the simulated phantom with an inclusion at the center. Parametric images enhanced by effective scatterer diameter using (b) non-Welch method, (c) conventional Welch’s method, and (d) new method. The size of each region of interest is 5 spatial pulse lengths and 3 beamwidths in the axial and the lateral direction, respectively. The thick broken lines denote the boundary of the lesion.

