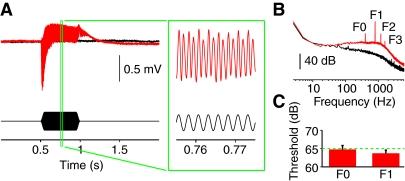
Fig. 5.
Field potentials in Johnston's organ. (A) Sample response to 400 Hz in a female fly (averaged over 85 repetitions). Control recording from the eye is overlaid in black; stimulus is shown below. Recordings were made over a wide range of intensities; this example is for 107 dB, where the high signal-to-noise ratio made the response clearly visible. (B) Spectral analysis of the sample response in A. Labels F1 to F3 indicate harmonics of the 400 Hz fundamental frequency, F0. (C) Response thresholds (75% criterion) averaged across 11 females. Thresholds are shown separately for components of the response at the stimulus frequency (F0) and twice the stimulus frequency (F1). The dashed line indicates the lowest intensity used in the learning experiments.

