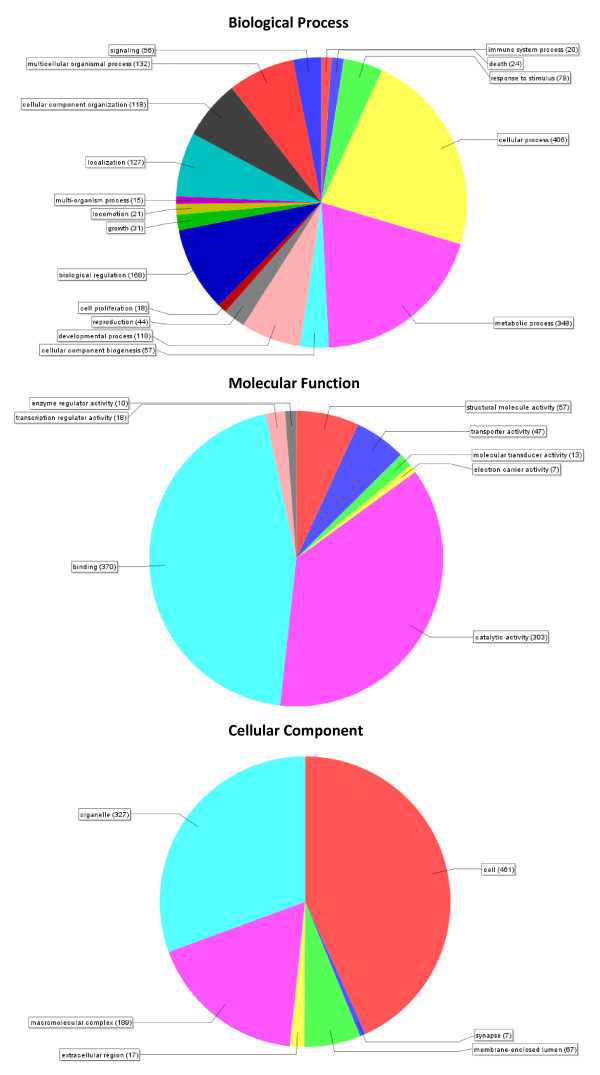
Figure 1.
Pie charts demonstrating distribution of second-level GO terms across the three major GO categories. Top pie-chart represents the GO category Biological Process, middle chart represents Molecular Function and the bottom chart represents Cellular Component. Number in brackets represents the number of P. ovis ESTs associated with each GO category. NB: Each individual EST may be associated with more than one GO category.

