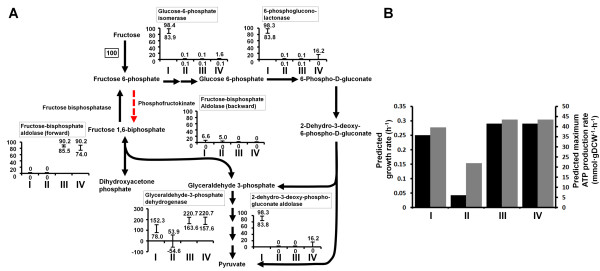
Figure 3.
Effects of expression of phosphofructokinate reaction in R. eutropha. It was investigated for wild-type strain (I), eda- deficient strain (II), eda- deficient and pfk-expressing strain (III), and both edd- and pfk-expressing strain (IV) of R. eutropha. (A) Pathway and flux distribution of the central metabolism for each strain. The flux distribution was investigated by flux variability analysis (FVA). The y axis in each graph indicates the relative flux (%) that is normalized to the carbon source uptake rate, which is D-fructose uptake rate. The upper and lower values in each graph indicate the maximum and minimum values, respectively, in flux variability. (B) Predicted growth rate and maximum ATP production rate for each strain. The black bar denotes the predicted growth rate and the grey bar denotes the predicted maximum ATP production rate.

