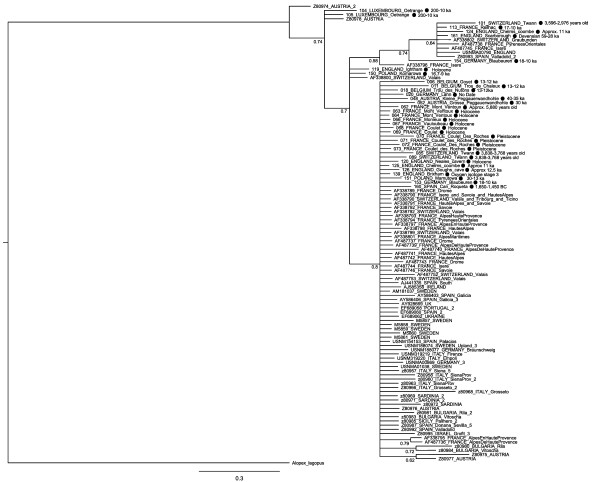
Figure 2.
Bayesian tree. This tree was produced using a partitioned dataset including cytochrome b and the control region for all ancient samples and modern samples. Many modern samples only had one gene represented, and so the other gene was coded as missing data. Ancient samples are marked with a black circle and an approximate date, whilst all others are modern samples.

