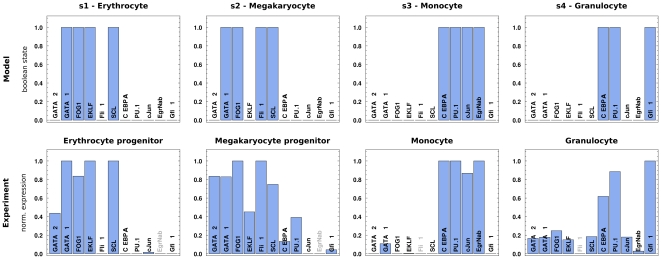
Figure 4. Comparison of Boolean states (top) with normalized mRNA expression profiles (bottom) for the 11 players of our model (see text for a detailed discussion).
We observe a good agreement between model prediction and measured mRNA expression. Note that we excluded non-differentially expressed genes with a maximum fold change smaller than 2 in all samples of the respective study (EgrNab in Pronk et al. [51] and Fli-1 in Chambers et al. [50], greyed out). For a discussion of the mismatch between prediction and data for GATA-2, see main text.

