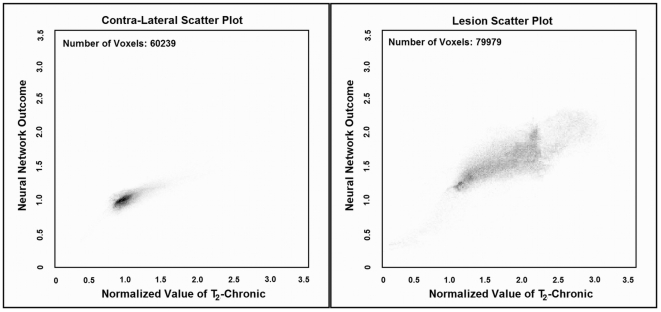
Figure 4. Scatter plots of the optimized ANN (4∶3∶3∶1) for predicting lesion and normal areas of 83 slices in 12 patients compare to their T2WI at chronic (gold standard).
As shown in these figures, the ANN prediction is highly correlated (Total voxels: 140218, r = 0.80, p <0.0001) with the T2WI at three month.

