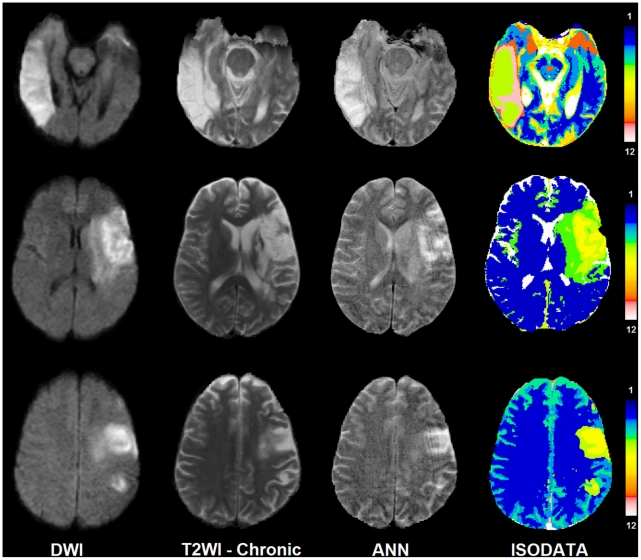
Figure 6. This figure presents DWI, T2WI-Chronic, ANN, and ISODATA maps for 3 different patients.
In ISODATA maps the lesions are clustered into 2 to 3 different signatures [from top to bottom: (5, 6, and 8), (2, 3, and 4), (3 and 4)]. Signature number indicates the chance of tissue recovery. The higher the signature values, the lower the chance of recovery.

