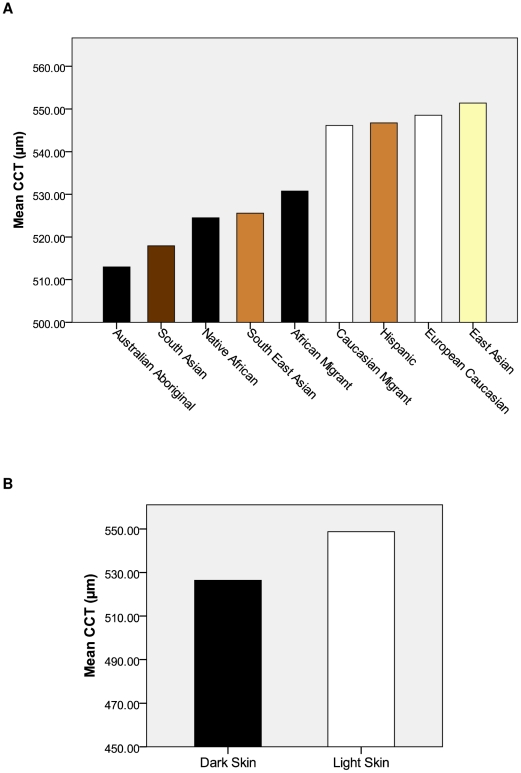
Figure 3. Graphical representation of the human CCT meta-analysis results.
(A) Mean CCT of each ethnic group. Colours indicate tone of skin pigmentation according to the chart devised by Biasutti, 1941 (see Figure 1) (B) Mean CCT of the Dark Skin (524.6±33.6 µm, n = 16,472) and Light Skin (548.4±34.1 µm, n = 14,152) groups based on the skin colour of the ethnic groups in Figure 1A. There was a significant difference between the groups (p<0.001).

