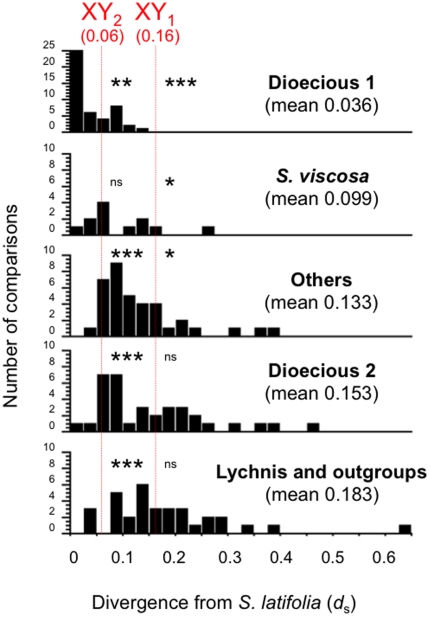
Figure 3. Divergence between sex chromosomes and between Silene species.
Distribution of synonymous divergence values (mean d S values, estimated using PAML) from pairwise comparisons between S. latifolia and the other species for the 13 genes. One such comparison is for S. viscosa, and the others are for the following groups of species: Dioecious 1 = S. dioica, S. diclinis, S. marizii, S. heuffelii, Dioecious 2 = S. otites, S. acaulis, S. nutans (although, as noted in the text, most S. nutans populations are gynodioecious), Others = S. vulgaris, S. conica, S. noctiflora, Lychnis and outgroups = Lychnis flos-jovis, Lychnis coronaria and outgroups. In addition, vertical arrows indicate the average d S between the S. latifolia X and Y sequences for SlXY4 and SlXY7, which belong to the oldest stratum of X-Y divergence (symbolised by XY1), and for SlCyp-XY (labelled XY2), a gene which belongs to the “intermediate stratum” that stopped recombining considerably later than the first two genes [15], [16], [75]. For each panel in Figure 3, we performed a sign-test (see Methods) of whether either the XY1 or the XY2 d S value is significantly different from the mean in the panel (e.g. for the top panel, we tested S. latifolia vs. Dioecious 1). Significant differences are indicated as follows: * p<10−1, ** p<10−2, *** p<10−3; ns = non-significant differences.

