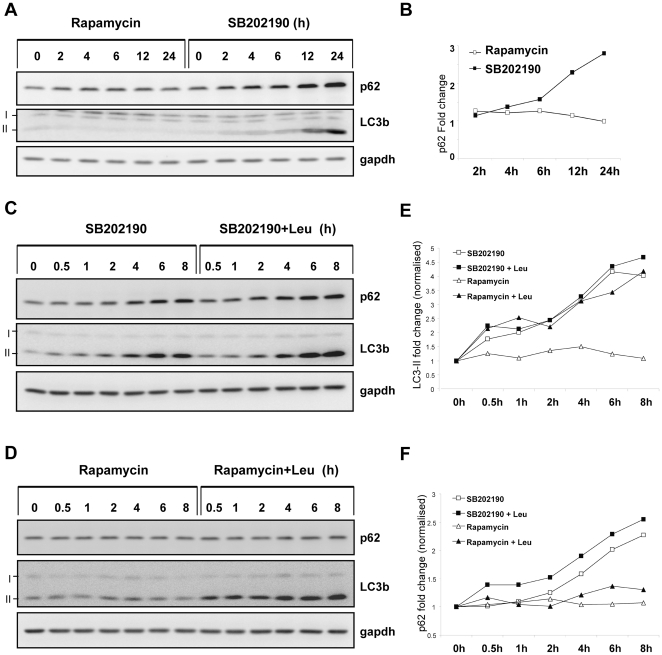
Figure 3. Differential effects of SB202190 and rapamycin on autophagic proteolysis.
(A) Cells were treated for indicated time periods with 50 nM rapamycin or 5 µM SB202190 and lysates were analyzed for LC3b and p62 levels by western blotting. (B) p62 band intensities from panel A was quantified using Image J software, normalized to gapdh and plotted. (C) HT29 cells were treated for indicated time periods with SB202190 (10 µM) in the presence or absence of 200 µg/mL leupeptin and autophagy substrates analyzed by western blot (D) Cells were treated with rapamycin (100 nM) alone or in combination with leupeptin and analyzed (E) LC3-II band intensities from panel C and D were quantified as in panel B (F) p62 band intensities from panel C and D were quantified as described in panel B.

