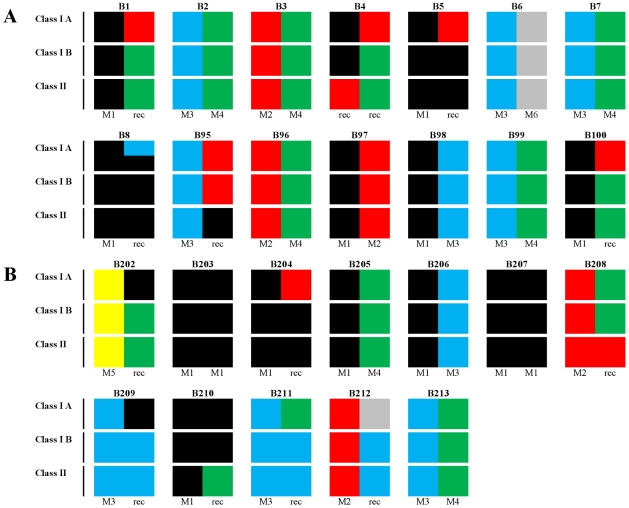
Figure 2. Distribution of MHC haplotypes in 26 Mauritian cynomolgus macaques.
MHC genotype distribution for the in vivo titration of SIVsmE660 (see Figure 1) in macaques B1–B8 and B95–B100 (panel A). Twelve macaques (B202–B213) were included in the vaccine/challenge study (panel B). Distribution of M1–M6 haplotypes for Class IA, Class IB and Class II for each animal is shown in pictorial format represented as: M1 (black); M2 (red); M3 (blue), M4 (green), M5 (yellow) and M6 (grey). No M7 haplotype was identified. Recombinants are represented as multiple colours.

