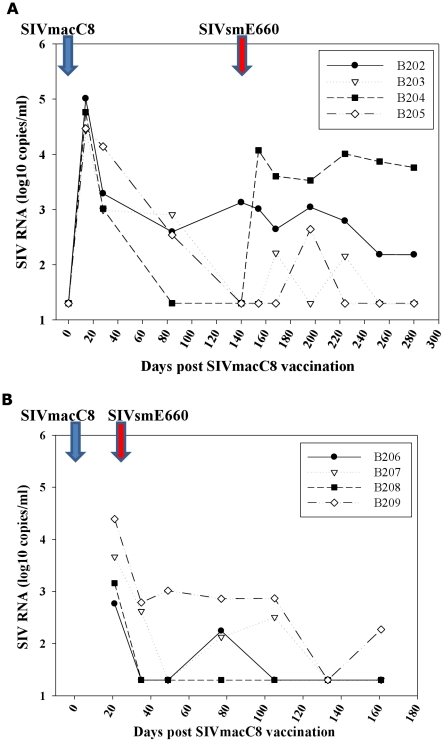
Figure 3. Vaccine virus kinetics.
Kinetics of virus replication post-SIVmacC8 vaccination measured by SIVmac251/C8-specific quantitative RT-PCR in 20 weeks (Group A) and 3 weeks (Group B) vaccinates. Blue arrow shows point of SIVmacC8 inoculation, red arrow point of SIVsmE660 challenge. Differences in vaccine kinetics between vaccinates in Panel A, Group A (B202–B205), after the peak of virus replication was seen, prior to SIVsmE660 challenge. Panel B, shows a single time-point 21 days post SIVmacC8 inoculation, ie day of SIVsmE660 challenge. In both Groups A and B, recrudescence of the vaccine virus SIVmacC8 upon SIVsmE660 challenge is shown.

