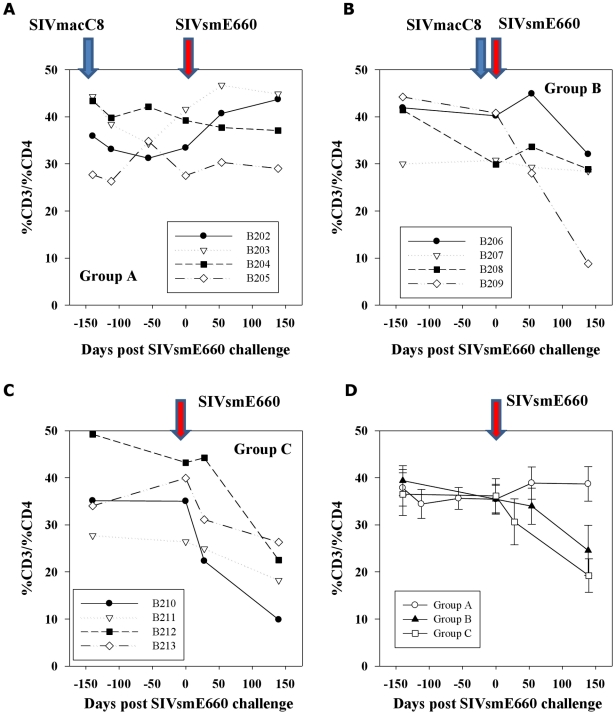
Figure 5. CD4 lymphocyte percentages.
CD4 lymphocyte percentages are shown for 20 week SIVmacC8 vaccinates (Group A; panel A) or 3 weeks (Group B; panel B), following SIVsmE660 challenge and unvaccinated challenge controls (Group C; panel C). Timings of all bleeds were taken from initial time of SIVsmE660 challenge (day 0). Group mean values with SE of the mean values are shown in panel D.

