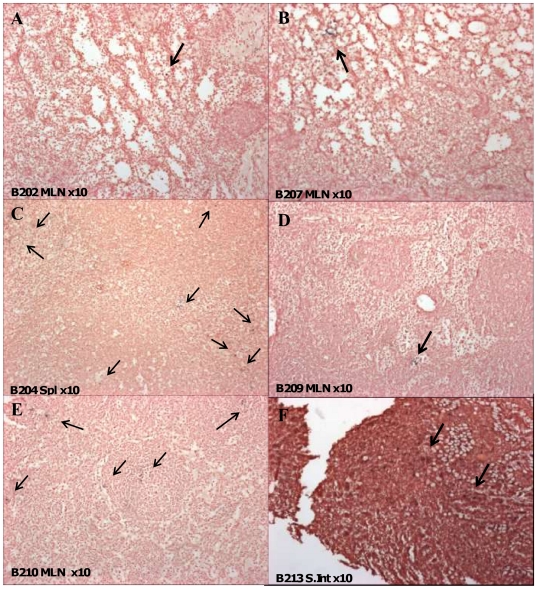
Figure 10. Distribution of SIV RNA positive cells by ISH in protected/unprotected vaccinates and SIVsmE660 controls.
Panels A and B) Mesenteric lymph node (MLN) sections from 20 and 3 week SIVmacC8 vaccinates (B202 and B207) protected from SIVsmE660 challenge. Panels C and D show spleen (spl) and MLN from 20 and 3 week SIVmacC8 vaccinates subsequently superinfected with SIVsmE660. B204 shows multiple foci of SIV RNA positive cells in spleen. Panels E and F show MLN and small intestine (S.Int) sections of naive challenge control macaques B210 and B213 after 20 weeks SIVsmE660 infection. B213 exhibits occasional clusters of SIV positive cells. Black staining indicates foci of SIV infection as indicated by arrows.

