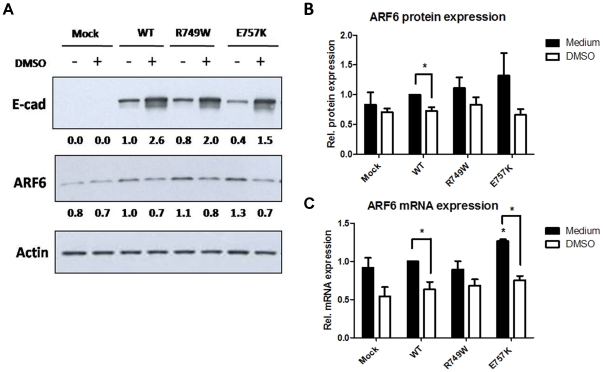
Figure 1. DMSO increases E-cadherin expression and modulates Arf6 expression.
(A) CHO cells stably transduced with the empty vector (Mock) or with WT, R749W or E757K hEcadherin were treated with 2% DMSO for 24 h. E-cadherin, Arf6 and Actin were detected in whole cell lysates by Western Blot. Actin was used as a loading control. The images shown are representative of three independent experiments. The intensity of the bands was quantified and normalized against the non-treated WT E-cadherin expressing cells. The intensity average is shown below the respective images. (B) The graph shows the average + SE of Arf6 protein level in cells with or without DMSO treatment, in three independent experiments. (C) ARF6 and 18S mRNA levels were analyzed by real-time PCR. 18S was used as endogenous control. The graph represents the average + SE of ARF6 mRNA, n = 3 (* represents p≤0.05).

