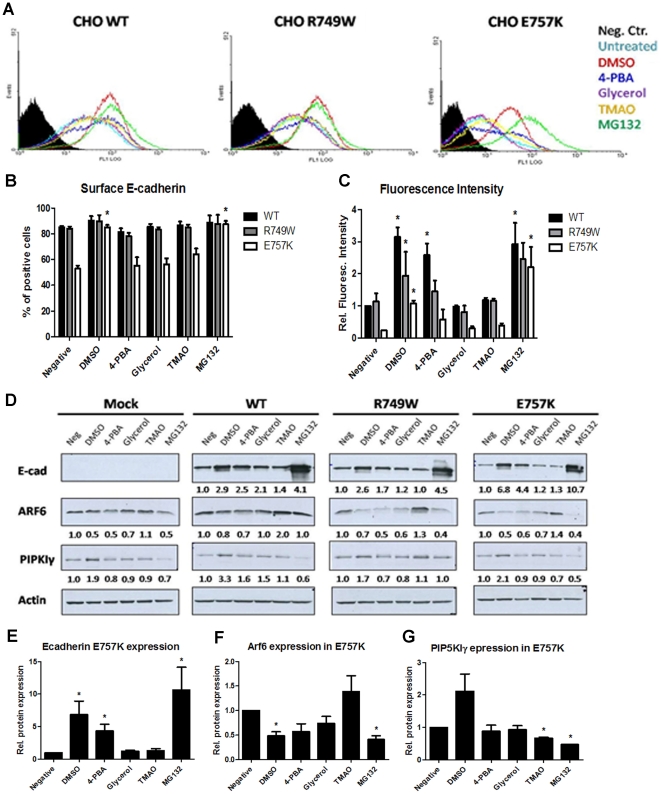
Figure 2. Distinct Chemical Chaperones recover E-cadherin expression by modulation of Arf6.
CHO cells stably transduced with the empty vector (Mock) or with WT, R749W or E757K hEcadherin were treated with 2% DMSO, 5 mM 4-PBA, 5% Glycerol, 100 mM TMAO and 10μM MG132. (A) Flow cytometry technique was used to assess E-cadherin in cell surface. Each histogram represents the surface E-cadherin expression in cells untreated, treated with the different CC or with proteasome inhibitor MG132. The black area in the histogram represents the cells that were not incubated with primary antibody, this sample was used as negative control. (B) For each sample, the mean of cells expressing surface E-cadherin was calculated. The graph shows the average + SE of three independent experiments. (C) The mean fluorescence intensity was also quantified and normalized for cells untreated expressing WT E-cadherin. The graph shows the average + SE, n = 3. (D) E-cadherin, Arf6, PIPKIγ and Actin were detected in whole cell lysates by Western Blot. Actin was used as a loading control. The intensity of the bands was quantified and normalized against the untreated cells. The average of three independent experiments is shown below the respective sample. (E) The graph shows the average + SE of E-cadherin protein level in mutant E757K cells after treatments. (F) The bars represent the average + SE of Arf6 protein level in mutant E757K cells after treatments. (G) Quantification of PIPKIγ protein level in mutant E757K cells after treatments. * represents p≤0.05.

