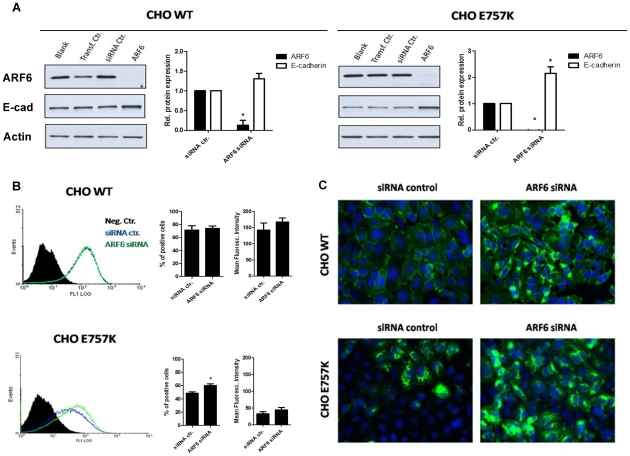
Figure 3. Arf6 specific inhibition by siRNA leads to an increase of E-cadherin protein expression.
Arf6 inhibition by siRNA was performed in CHO cells stably transduced with WT or E757K hEcadherin. (A) Cell lysates were extracted 48 h after transfection. E-cadherin, Arf6 and Actin were analyzed by Western Blot. Actin was used as a loading control. The intensity of the bands was quantified and normalized against the siRNA control. In the graph, bars represent the average + SE of E-cadherin or Arf6 protein expression of three independent experiments. (B) Flow cytometry technique was used to assess E-cadherin cell surface expression. Each histogram represents the cell surface expression of E-cadherin in WT or E757K cells treated with siRNA control (blue) or with specific siRNA for Arf6 (green). The black area in the histogram represents the cells that were not incubated with primary antibody; this sample was used as negative control. For each sample, the number of cells expressing surface E-cadherin as well as the mean fluorescence intensity (arbitrary units) was calculated. The graphs show the average + SE of three independent experiments (* represents p≤0.05). (C) Cells were fixed 48 h after transfection and immunostained with anti-human E-cadherin antibody. Nucleus was counterstained with DAPI. The pictures were taken under a 40× objective.

