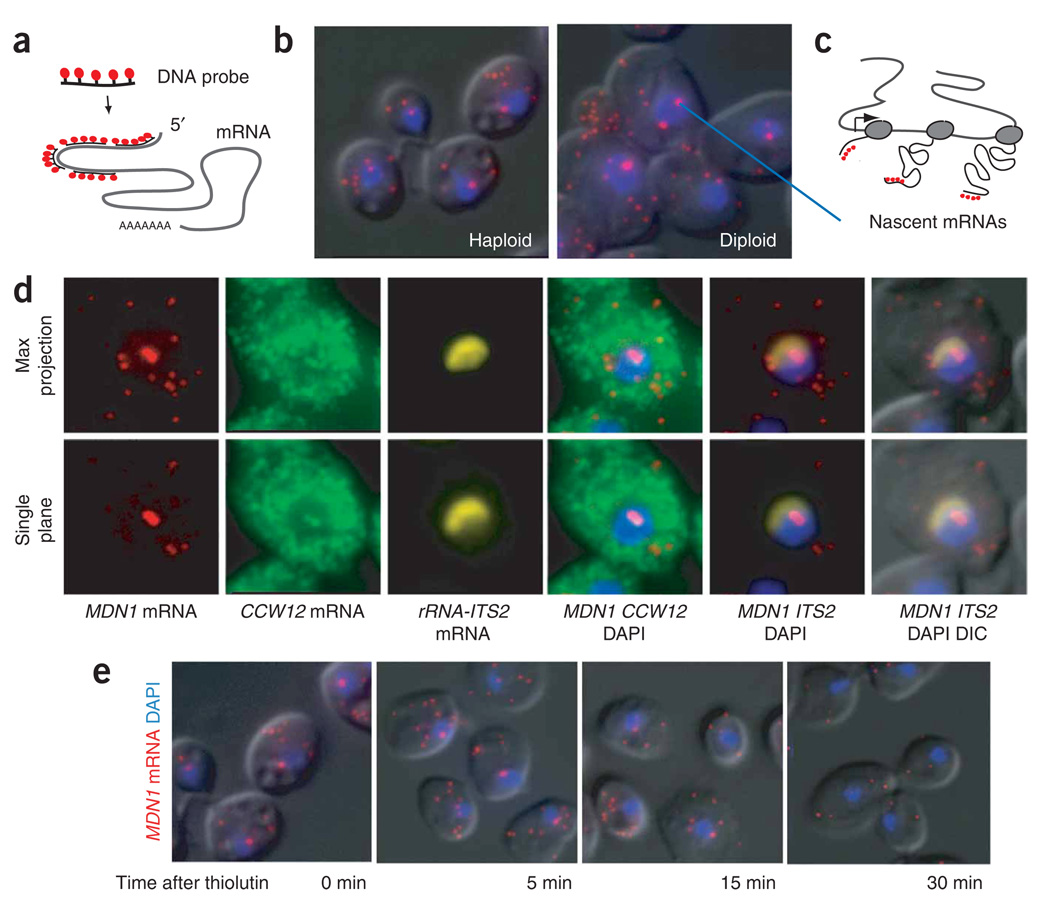
Figure 1.
Single mRNA–sensitivity FISH. (a) Schematic diagram of the FISH protocol. A mixture of four 50-nt DNA oligonucleotides, each labeled with five fluorescent dyes, is hybridized to paraformaldehyde-fixed yeast cells to obtain a single-transcript resolution. (b) Single-mRNA FISH for MDN1 mRNA. Single mRNAs are detected in the cytoplasm, with a higher intensity spot in the nucleus. Haploid and diploid yeast cells are shown. Probes hybridize to the 5′ end of the mRNA. MDNI mRNA, red; DAPI, blue; superimposed on the differential interference contrast (DIC) image. (c) Cartoon showing how the number of nascent mRNAs at the site of transcription is used to determine the polymerase loading on a gene when using FISH probes that hybridize to the 5′ end of the gene. (d) Nascent transcripts of neighboring genes colocalize at the site of transcription. Diploid cells are hybridized with probes against MDN1 (labeled with cy3) and CCW12 (labeled with cy3.5). The nucleolus is stained with probes against the ITS2 spacer of the ribosomal RNA precursor (labeled with Cy5). Maximum projection of a three-dimensional data set and single plane containing the transcription sites is shown. (e) Nascent-transcript detection requires ongoing transcription. Cells were fixed 0, 5, 15 and 30 min after addition of the transcription inhibitor thiolutin (4ug ml−1) to the media. FISH was carried out using probes to MDN1 mRNA as shown in b. Representative cells are shown for each time point.

