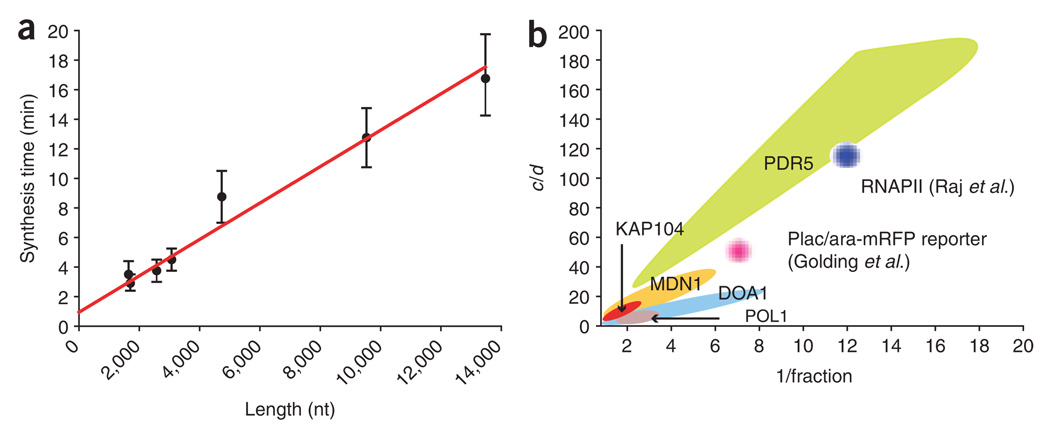
Figure 8.
Extracting kinetic data from fixed-cell analysis. (a) Determining polymerase speed from FISH data. The synthesis time (τ) is plotted against the length of the gene. The length is determined from the position of the FISH probe nearest the 3′ end of the gene. Error bars indicate s.d. determined from the model by allowing τ to vary for a fixed set of a, b and c parameters. The slope of the line gives (polymerase speed)−1, resulting in a speed of 0.80 ± 0.07 kb min−1; the y intercept corresponds to a termination time of 56 ± 20 s. The individual data points correspond to the previously described genes (KAP104, DOA1, MDN1, POL1 and PDR5) and multiple regions of MDN1. (b) The parameters space for endogenous gene transcription. The statistically significant models for each gene are presented as in Figure 7. The y axis is the initiation rate constant c normalized by the mRNA decay constant d, which allows for comparison between genes. 1/fraction = (a + b)/a. For the genes studied in this report (MDN1, KAP104, DOA1, POL1, PDR5), the colored regions represent the actual parameter space for a, b and c. For the genes described in previous reports15,21, the full parameter space was not reported. The approximate value of a, b and c is based on the findings of these authors (Raj et al.: c/d ~ 120; 1/f ~ 12. Golding et al.: c/d ~ 50; 1/f ~7), but the physical extent of these regions as depicted in b is only for graphic display.

