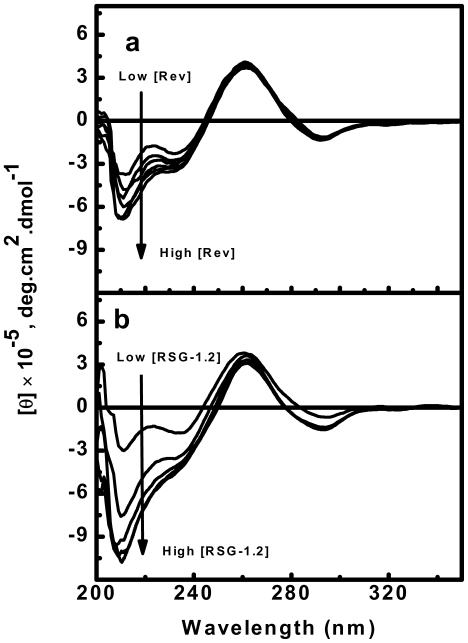
Figure 2. CD spectra showing the structural changes in RRE-IIB upon addition of peptides.
CD spectra of RRE-IIB alone and in the presence of peptide toRRE-IIB molar ratio of 1∶1, 2∶1, 3∶1, 4∶1 and 5∶1 (a) Rev peptide (b) RSG-1.2 peptide. The concentration of RNA used is [RNA] = 5 µM. All CD spectra were collected in buffer, consisting of 10 mM sodium cacodylate, 50 mM NaCl and 0.l mM EDTA at pH 7.5 and 25°C. Molar ellipticities, [θ], are in units of deg cm2 dmol−1, where M refers to moles of RNA strand per litre. The direction of arrow shows the increasing concentration of peptides.

