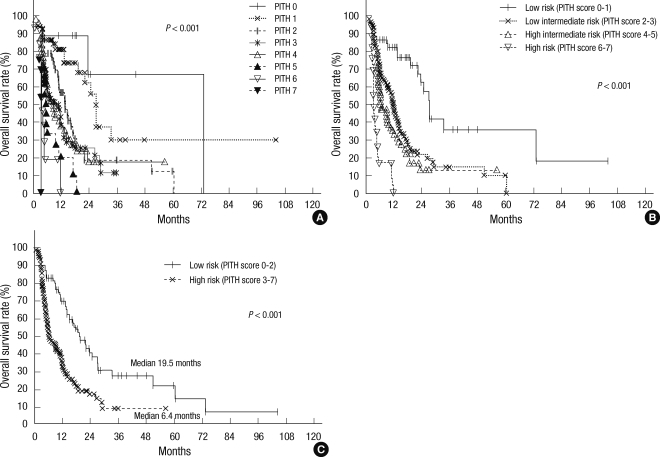
Fig. 3.
Overall survival according to PITH scoring (A, all groups; B, 4 groups; C, 2 groups): Kaplan-Meier curves for overall survival rate according to PITH scoring. PITH score was calculated by the number of prognostic factors; ECOG performance status (≥ 2), Child-Pugh class (B or C), multiple tumor (more than 2), main PVTT, complete portal vein occlusion, lymph node metastasis, and primary tumor size (≥ 10 cm). PITH scores correlated well with OS (A). Patients were divided into four groups (B) and two groups (C) for statistical analyses.

