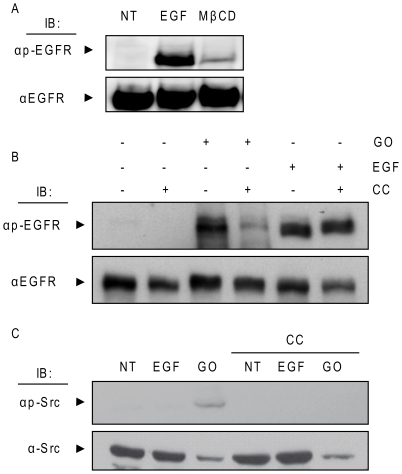
Figure 8. Cholesterol levels modulate EGFR activation by H2O2.
A. Serum-starved A549 cells were treated, or not, with 100 ng/ml EGF for 15 min. or 2% (w/v) MβCD for 1 h and cell lysates were IBed for total and Tyr-phosphorylated EGFR. B and C. Cells were treated with EGF as in A or with 1 U/ml GO for 30 min. in the absence or presence of 2 mM MβCD-cholesterol complex (CC), prepared as described in “Material and Methods”. Cell lysates were separated by SDS-PAGE and IBed for total and Tyr-phosphorylated EGFR (B) or total and Y416 phosphorylated Src (C).

