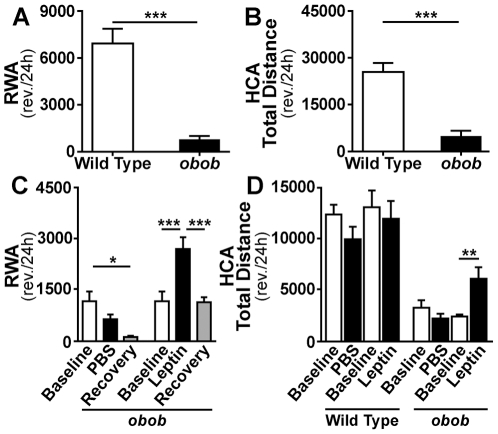
Figure 1. Locomotor responses to leptin in obob mice.
(A and B) 24 hour running wheel activity (RWA) and home cage activity (HCA) in obob and wild type (WT) mice. ***p≤0.001 (A, WT n = 11 and obob n = 12; B, WT = 9 and obob n = 6). (C) Effect of leptin (150 ng/h) on 24 h RWA in obob mice. RWA decreased (*p≤0.05) with time and vehicle (PBS) in the obob mice (n = 6 for each group). In contrast, RWA activity increased (***p≤0.001) during leptin. (D) Effect of leptin (150 ng/h) on 24 h HCA in WT and obob mice. Leptin increased HCA in obob mice (**p≤0.01), but not in WT mice (n = 6 for each group).

