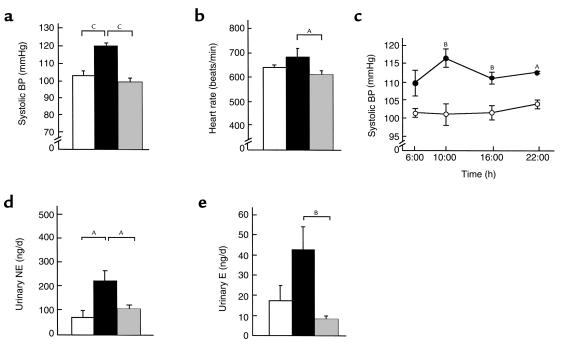
Figure 1.
Profiles of transgenic skinny mice, ob/ob mice, and their control mice. Systolic BP (a) and heart rate (b) in 12-week-old transgenic skinny mice (black bars), ob/ob mice (shaded bars), and their control mice (open bars). (c) Daily profile of systolic BP in 12-week-old transgenic skinny mice (filled circles) and nontransgenic littermates (open circles). Urinary NE (c) and E (d) excretion levels in 12-week-old transgenic skinny mice (filled bars), ob/ob mice (shaded bars), and their control mice (open bars). AP < 0.05, BP < 0.01, and CP < 0.001 compared with control mice assessed by 1-way ANOVA with Bonferroni Dunn test (a, b, d, e), and by ANOVA with repeated measures analysis with Student’s t test at a given time (c).

