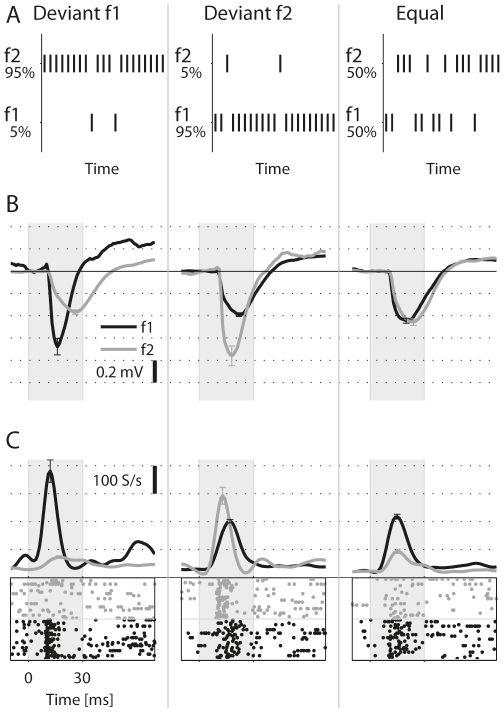
Figure 1. The oddball paradigm.
A. A schematic spectrographic representation of the three basic sequences used in this study. In each trial, either f1 or f2 are presented pseudo-randomly according to their probability of occurrence. B. The average LFP responses in a typical recording site to the two frequencies of the paradigm in each of the sequences (f1 = 13.3 kHz, black, and f2 = 19.2 kHz, gray). The level was 30 dB attenuation (∼70dB SPL). Error bars: ± s.e.m., shaded interval: stimulus. C. MUA Responses at the same site. The raster plots show 25 presentations for each of the two frequencies, corresponding to 5% of the 500 tone presentations in the sequence. For the standard and equal-probability conditions, which had more than 25 presentations in a sequence, the 25 presentations were selected so that they represent the spike count distribution of all responses in the time window shown. The line graphs represent PSTHs smoothed by a 10 ms Hamming window.

