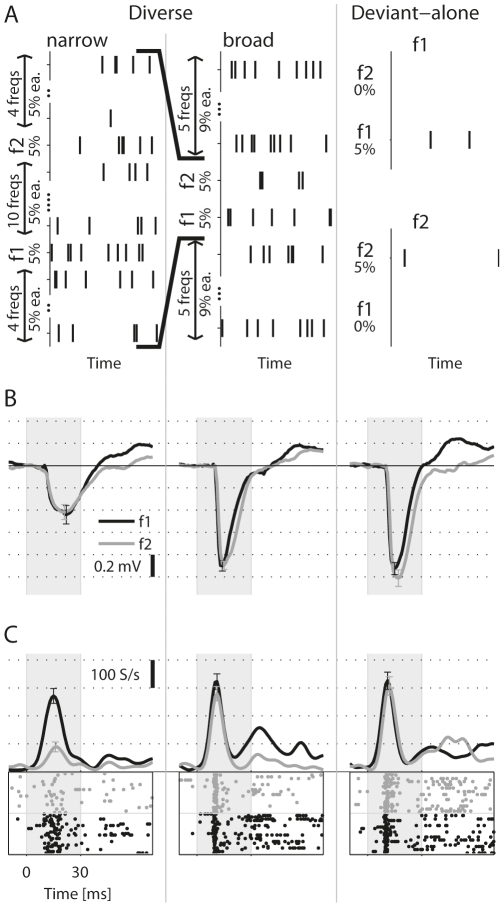
Figure 3. The control sequences.
A. The three control conditions. In the ‘Diverse’ sequences, narrow and broad, the available frequencies were evenly spaced on a logarithmic frequency scale. The range of frequencies was narrow (about twice Δf) in the Diverse-narrow sequence, and wide (11Δf) in the Diverse-broad sequence. In the ‘Deviant-alone f1’ and ‘Deviant-alone f2’ sequences, the other 95% of the presentations were silent. B. The average LFP responses to frequencies f1 and f2 embedded in the control sequences (same recording site as Fig. 1). The responses in the two Deviant-alone sequences are superimposed. Error bars: ± s.e.m., shaded interval: stimulus. C. MUA Responses at the same site.

