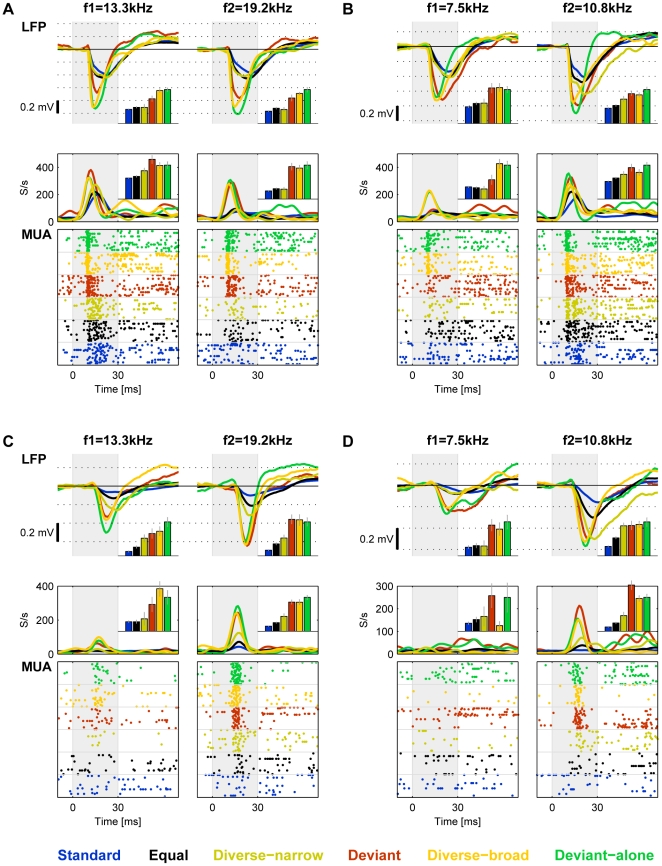
Figure 4. Typical responses to all conditions (Δf = 44%).
A. Responses of LFP and MUA recorded at the same site as Figs. 1 and 3 to f1 and f2 in all stimulus conditions, sorted by frequency. Insets: the amplitudes of the responses, normalized by the responses at the corresponding deviant-alone condition. The raster plots display only 25 representative responses in the standard and equal-probability conditions, as in Fig. 1. B. Responses recorded in the same recording site as A to sequences with different f1 and f2. C,D. Additional examples of the responses to all sequences, recorded from another rat.

