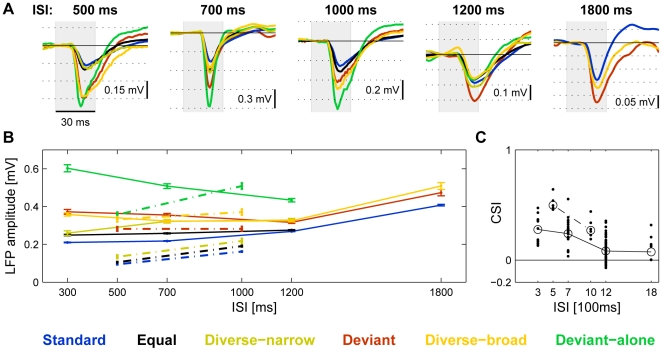
Figure 8. Respones as a function of ISI.
A. Average LFP responses at five different ISIs. The examples, from different animals, show the responses to the low frequency (f1) in each pair. B. The population average of the responses to different ISIs for the two groups of rats (continuous and dashed lines) used in testing the effects of ISI. The error bars are s.e.m. For more details, see text. C. The distributions of the individual CSIs at each ISI. Circles are ‘common’ averages, computed as the sum of all numerators of contrasts in each ISI value, divided by sum of all denominators.

