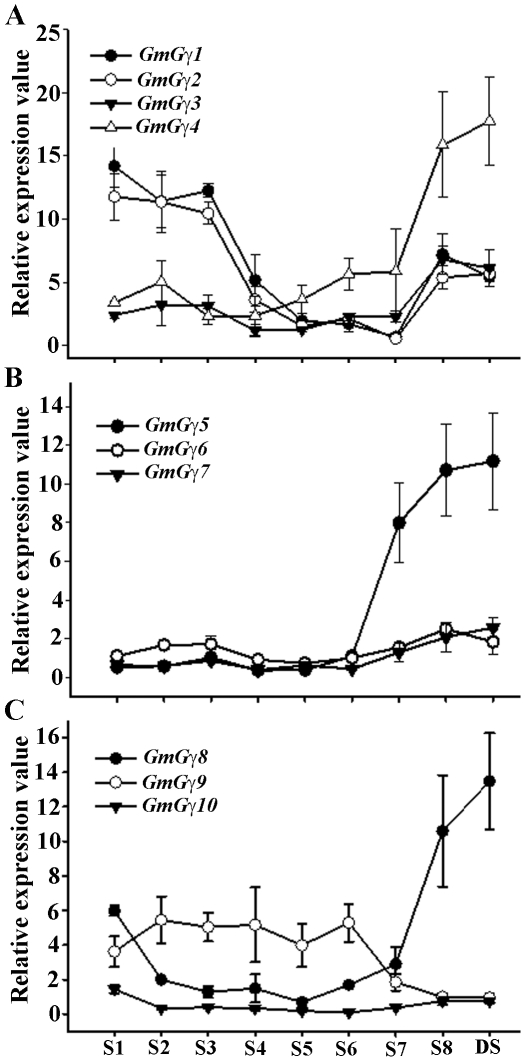
Figure 4. Expression of GmGγ genes during different stages of seed development.
The seed development stages (S1-S8) are as described in [10]. qRT-PCR amplifications were performed thrice independently for each target, and the data were averaged. The expression values across different seed stages were normalized against soybean Actin gene expression. Dry seeds (DS) were also used for the analysis. Error bars represent the standard error of the mean. (A) Relative expression of the group I GmGγ genes during different stages of seed development. (B) Relative expression of the group II GmGγ genes. (C) Relative expression of the group III GmGγ genes.

