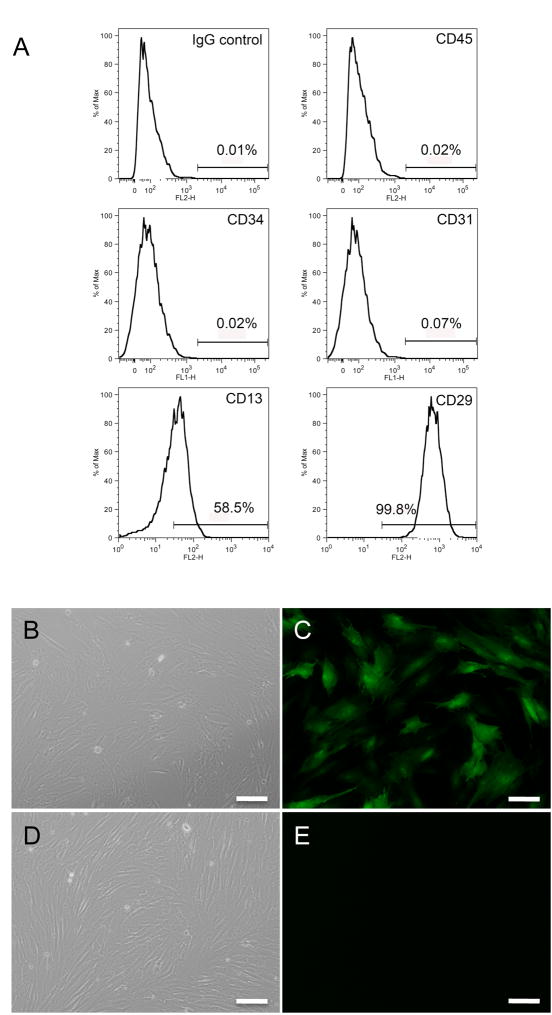
Figure 2. Characterization and Labeling of Porcine Bone Marrow derived MSC.
A) Analysis of MSC using flow cytometry: Histogram shows a positive cell population for cell surface markers CD29 and CD13, and negative for CD45, CD34 and CD 31, based on IgG isotype control. B) MSC after third passage observed under bright field microscopy. Scale bar=100μm. C) Same field of view shows MSC observed under fluorescent microscopy, 72 hours after infection with replication–deficient adenovirus encoding the reporter gene green fluorescent protein (GFP). Scale bar = 100μm. D) Non-infected MSC after third passage (control) shown under bright field and E) Fluorescence microscopy images obtained using same exposure time in infected and control cells, show absence of GFP positive cells in control.

