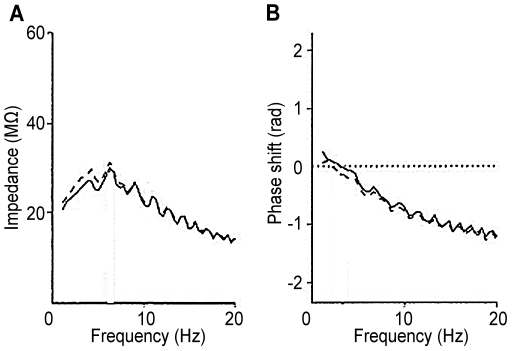
Figure 7. Empirical impedance amplitude and phase curves.
(A) Impedance amplitude profile. (B) Impedance phase shift curve. Recording electrode inserted in the soma (filled line), or inserted into the dendrite (dashed line)120–270  from the soma. Data from [45].

