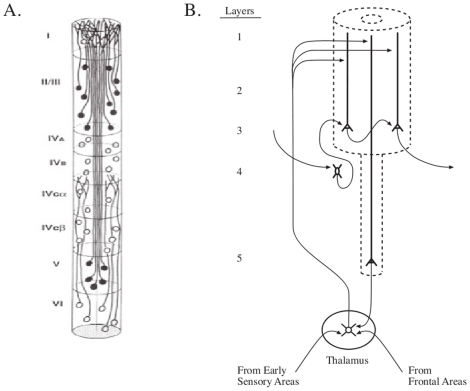
Figure 8. Cortical minicolumn and corticothalamic circuit.
(A) Schematic diagram of a minicolumn in monkey visual cortex (see Figure 19 in [46]). Shown are somas and apical dendrites of pyramidal neurons and somas of stellate neurons. (B) Schematic diagram showing the corticothalamic loop. A specific resonance profile in a Layer 5 apical dendrite is projected, via the thalamus, back to the first compartment of the same apical dendrite. The profile is also projected to apical dendrites of Layer 2/3 pyramidal neurons where it spreads to the basal dendrites and may influence the selection of inputs arriving from other cortical minicolumns. For clarity, the reticular nucleus, with its inhibitory projections to the thalamic principal neurons, is not shown. Adapted from [30], [31].

